Analyze
The objective of the Analysis phase is to surface insights and learning that meet your user's needs in terms of both content and format, as established during the Design phase workshops. That said, we're always delighted when an analysis generates surprises — something we didn't consider or know previously. Analyses provide explanations, surface the mechanics of change or change pathways, and reveal emerging trends.
You can use any qualitative data analysis method or tools to analyze the corpus (your set of stories). No matter what approach you use, analysis is going to feel messy. Because it is. There's a lot of information to sift through. You’re looking for commonalities, differences, themes, and outliers — What matters to people? Why does it matter? How do people talk about, characterize, understand what’s going on?
Analysis can be outsourced, however there are benefits to doing it in-house. During the StoryEngine pilot, some Mozilla staff took the initiative to conduct their own analysis to guide decisions they needed to make work. We heard that although the analytic process was not smooth — it's hard work! — it was productive and important to engage with the messiness and the volume of information, especially when done in collaboration with team members because then everyone had ownership over the findings and were highly motivated to use them.
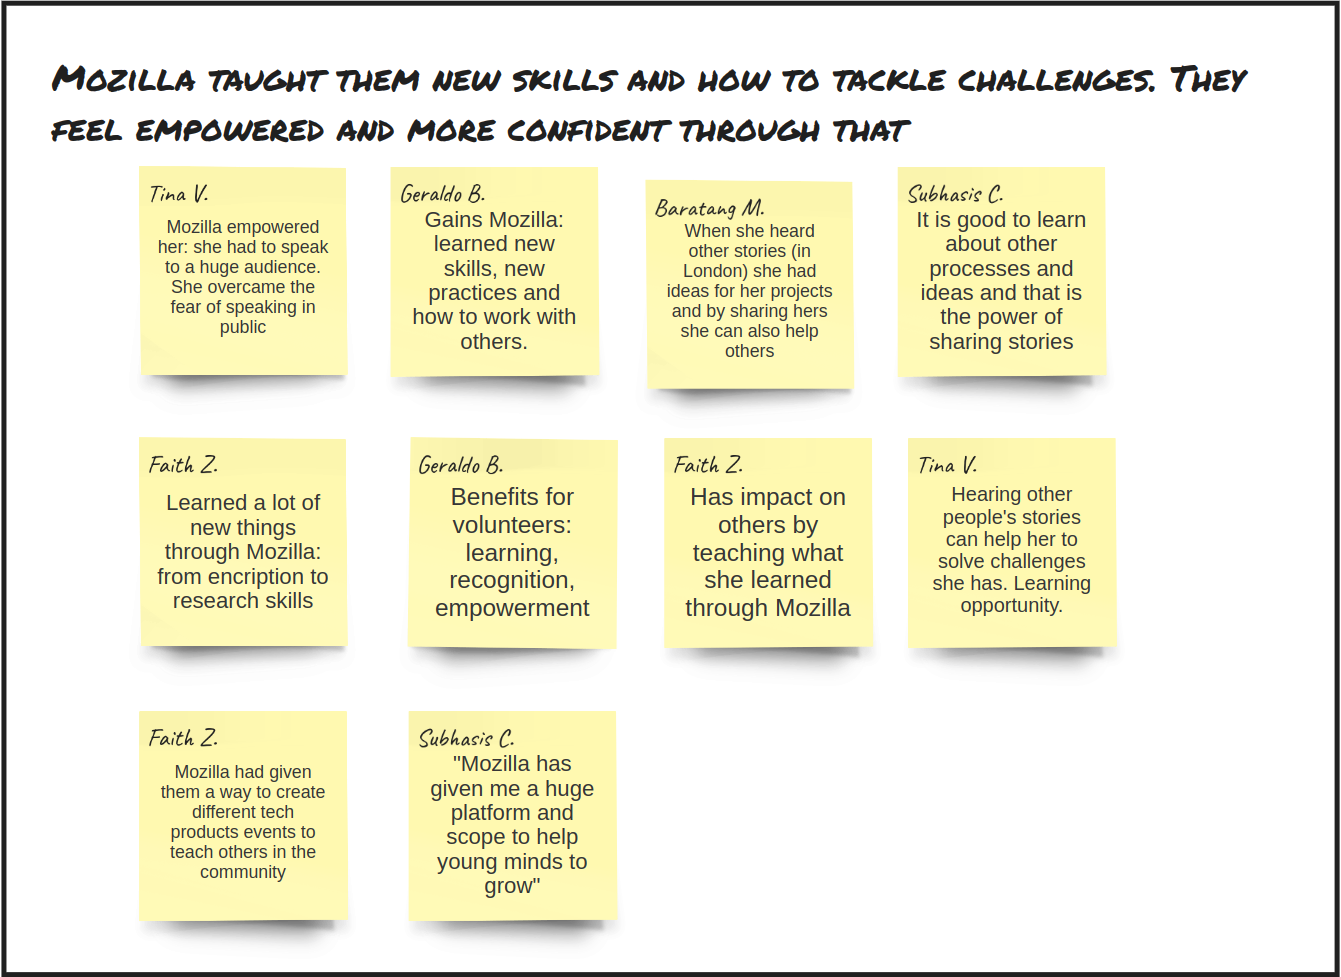
Example: A Realtime Board screenshot based on an analysis of StoryEngine stories, part of the process of developing personas
It's also possible to do mini-analyses of the stories that were published over the course of a month, a quarter, or after, say, every 10 stories. Likewise, you can do quick analyses on specific themes. For example, during the pilot we experimented with releasing a newsletter for Mozilla staff — “#InternetHealth Heroes” — which was well received. Creating it also provided an opportunity to investigate all the places where StoryEngine content has been used and shared — my participants as well as others.
What follows is our approach to conducting analysis. It's a lightweight guide based on our experiments, and not intended to be a full explanation of how to conduct qualitative data analysis or use computer assisted qualitative data analysis tools.
1. Choose your qualitative data analysis tool
Find a qualitative data analysis (QDA) tool that works for you. It can be as simple as as spreadsheet (see Using Excel to Organize Qualitative Data for Analysis) or something more complex like RQDA (free and open source) or Dedoose (proprietary yet affordable; good collaboration features).
NOTE: Our goal is for respondents to be able see how their words were being interpreted, and provide them the opportunity to feedback or add additional thoughts. We also liked the idea of open-on-the-web QDA. While a spreadsheet can be shared and commented on, we also tested Hypothes.is, an open and free web annotation tool. Hypothes.is is currently installed on StoryEngine.io to enable this. We also spoke with Hypothes.is leadership to let them know what we wanted to do and ask about emerging features. At this point it's not robust enough to be used for rigorous data analysis, although it is possible to create a controlled set of tags and export annotations and tags into a spreadsheet so they can be manipulated. We also learned about the practice of "Annotatathons" — view notes with examples — a promising approach to engagement and collaborative sensemaking. More in Learning & History...
2. Get to know the stories
Familiarize yourself with the corpus (the set of stories you'll be analyzing) by first skimming through the whole thing. Then, read through more carefully. Taking notes at each pass is especially helpful to help refine your approach and coding structure. Ask: What ideas, concepts, themes are you seeing?
3. Code published stories
We recommend using both preset and emergent codes — preset codes are codes assigned to ideas, concepts, or themes you expect to find during analysis (based on the learning questions you established during the design phase, as well as organizational hot topics or key areas of work), and emergent codes are codes that surface during your analysis. The idea with emergent codes is to surface things you weren’t expecting to find — these surprises are important.
What is a code?
A code is a short word or phrase assigned to an idea, concept, or theme. Coding your data is an essential part of performing qualitative data analysis — it helps you organize, sort, and visualize your data. It is iterative and will change as your analysis and work progresses.
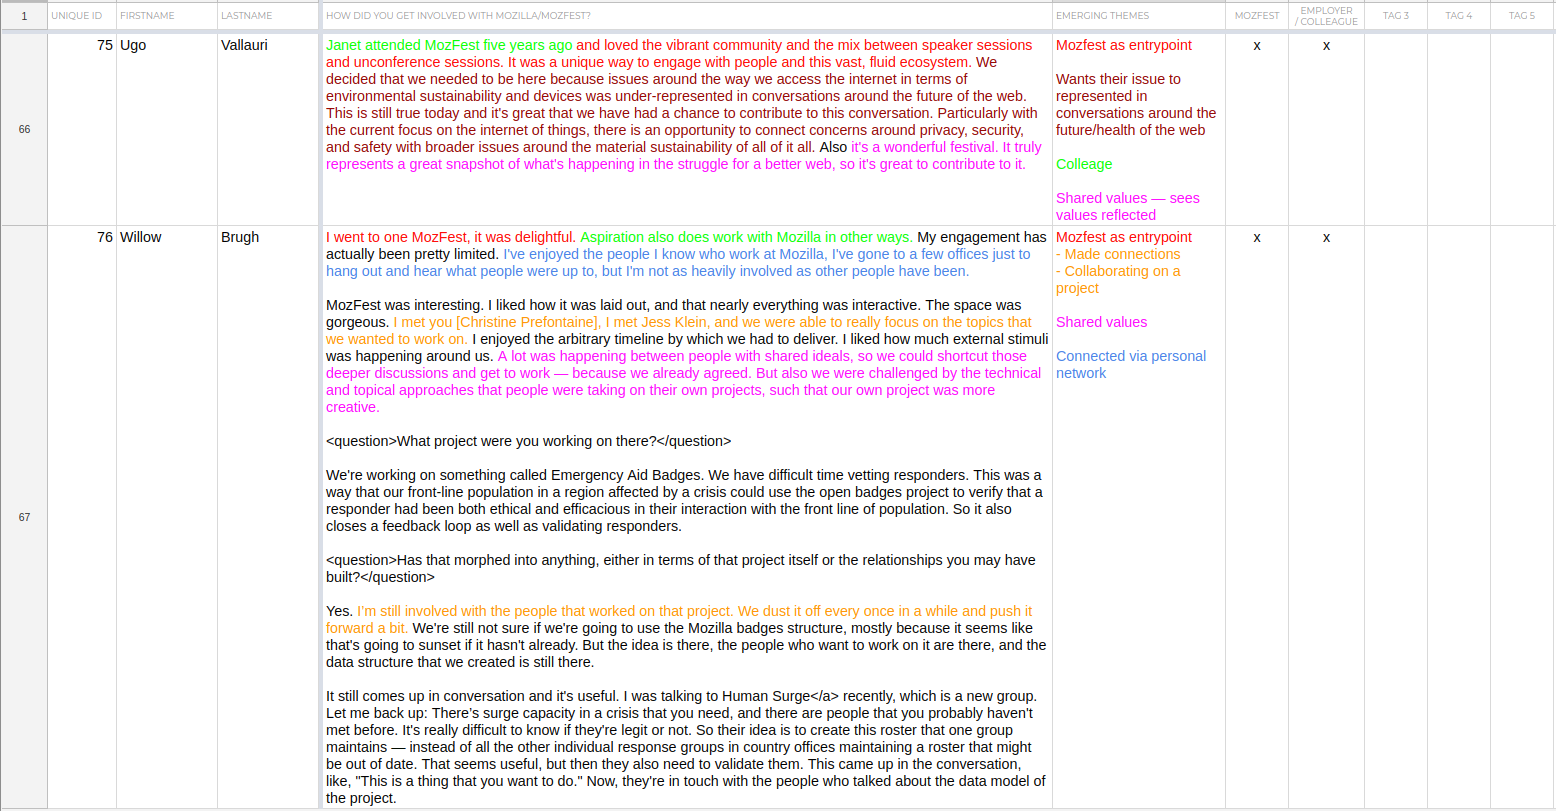
Coding your data
Assign identifier information to each interview — Decide what identifier information is important and assign identifier information accordingly. Examples of identifiers you might use: gender of participant, date of interview, age of participant, location of participant’s residence, and participant’s profession.
Determine preset codes and code your data set accordingly — Use your questions and notes to develop preset codes and initial coding structure — note that your coding structure will continue to develop over the coding process. Preset codes should cover ideas, concepts, and themes you expect to find based on the design of your questions — they will generally pop up in every interview, as the questions are specifically designed to uncover them. For example — we used the preset code, “success,” to identify passages of text in response to the question, “Tell me about a time you felt a sense of success.”
Use emergent codes to capture emerging ideas, concepts, and themes — As you make your way through the corpus, remember to utilize emergent codes to capture the things you didn’t expect to find.
REMEMBER: Coding is iterative and will change as your analysis and work progresses. This is especially true for emergent codes. You may find yourself combing back through interviews to make changes to your coding structure. For example, you may have coded passages of text in several interviews as “disagreement,” and in passages of text of other interviews as “dispute,” but later you realize that these two codes represent the same idea, so you synthesize your coding structure so that all “dispute” and “disagreement” codes are now “disagreement.”
4. Analyze and synthesize findings
Based on notes and coding, synthesize what you're learning. Using your preset codes, purposefully look for answers to the questions you documented during the Design phase. Then use emergent codes to organize emerging patterns and themes — What surprised you? What did you find that you weren’t looking for?
5. Package your findings for use
We recommend formatting your findings based on user needs — as established during the Design phase. For example, the initial StoryEngine pilot report for the Mozilla Foundation was framed and organized around their already-established strategic objectives and key results. Findings can also be packaged as personas, journey maps, timelines, and more — it all depends on what works for your users.
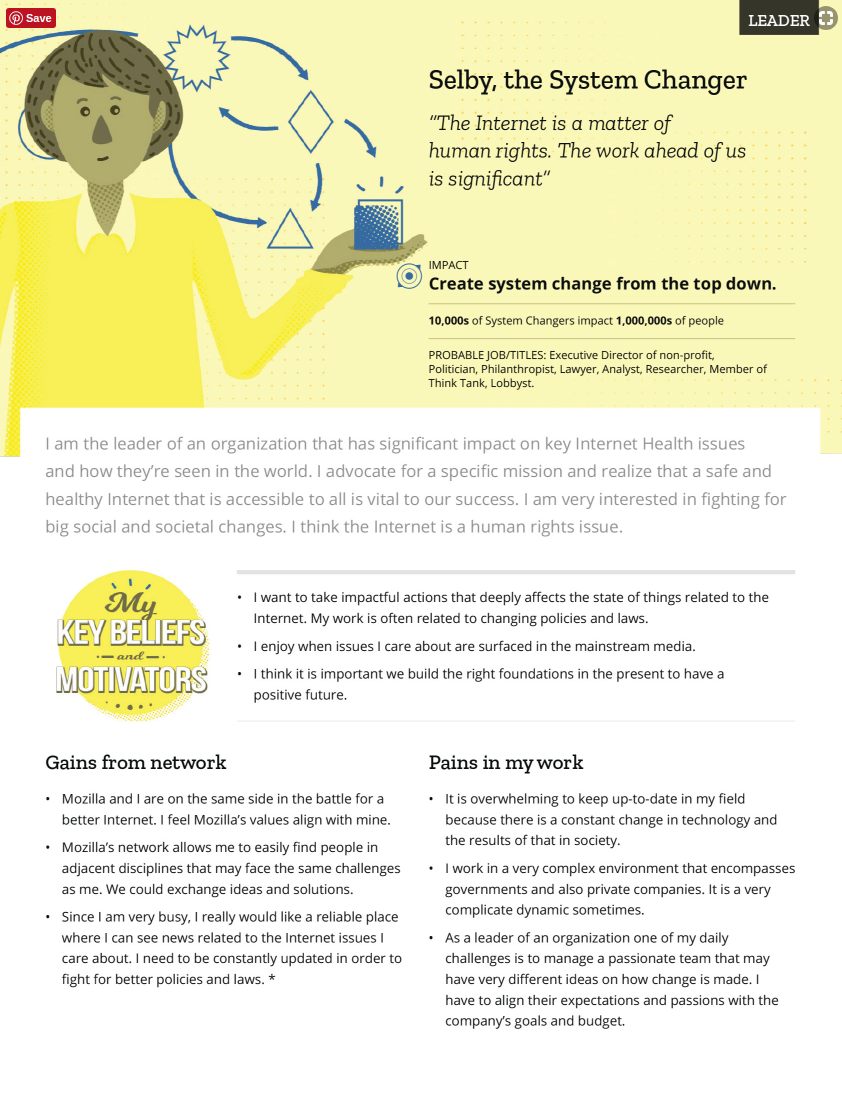
Example: Front a persona card developed my the Mozilla Foundation design team, based on their analysis of StoryEngine data and existing strategy documents

Now that your learning and insights are in a usable format, you're ready to Act & Loup Back.
Analysis tools & templates
- StoryEngine Data Structure & Analysis Test Results — Spreadsheet with a proposed data structure for better online display and filtering of participant attributes, questions, topics, and tags.
- Using Excel to Organize Qualitative Data for Analysis — Written by Susan Eliot (now retired). A simple yet effective way to use a spreadsheet to conduct analysis. We used Google Spreadsheets instead.
- Running an Annotatathon with Hypothesis